

90% of information transmitted to the brain is visual, and visuals are processed 60,000x faster in the brain than text. Stats like this can be a little staggering, but they show how crucial it is that your content has a visual element to it.
In this post we’ll go through a few ways to get more visual content, whether you have an in-house designer or not.
The first decision to make is what kind of content you’re making. Of course, if you’re creating an infographic piece this will be visual by nature.
If this is the way you’re going then a designer is definitely the way forward for something so bespoke. In this scenario, either use in-house resource, or look at freelance sites like PeoplePerHour or UpWork. for instance.
More often than not though, the content you will create on a regular basis will be either a written article or a social post.
It’s been proven time and again that photo posts perform better on social networks, and in a long-form written piece a featured image and image to break up the text is a must.
But if you’re creating maybe 2 written pieces and 10 social posts a week for instance, you need a quick and easy solution for creating visual content. Best options include the likes of Canva and PicMonkey. These tools allow you to make graphics from templated options, much like the below:
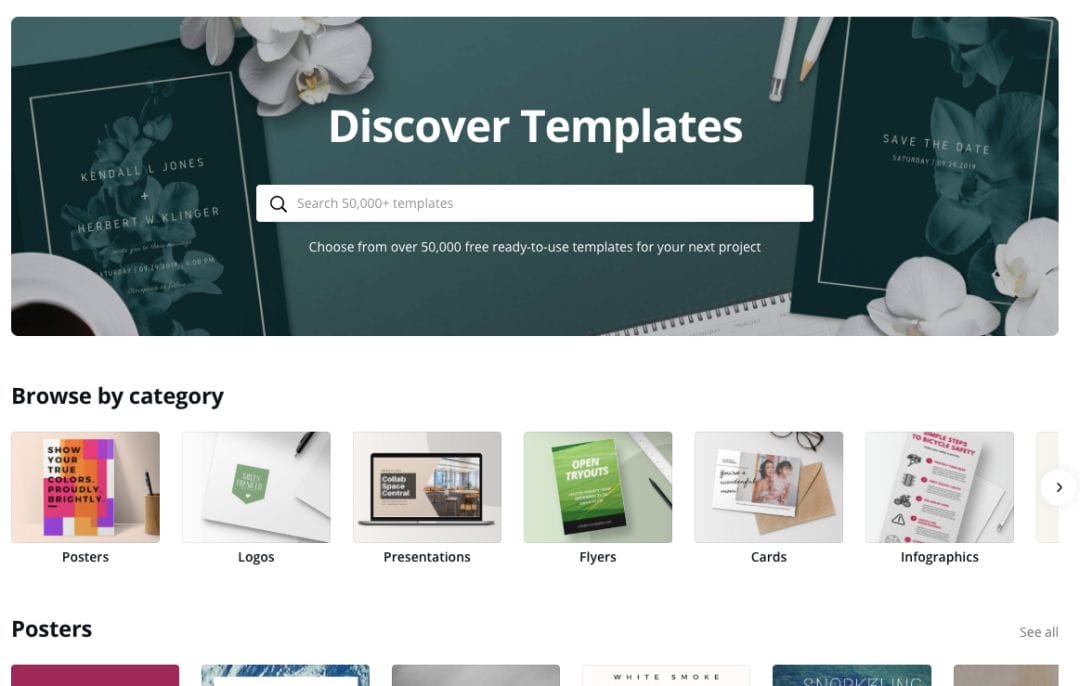
This is hugely useful for quick blog or social media graphics when needed.
The other aspect to consider is data visualisation. If you’ve got data around the piece you’re creating then you need to try to visualise this as it will make it more understandable and easily digestible. Tables and long explanations of data rarely work, whereas a visualisation can make all the difference.
Check out these examples how large amounts of data and information can be visualised.
There are a number of ways to visualise your data in this way. One great option is to use Tableau, which is a professional data visualisation tool. It’s pricey, but worth it if you’re doing a lot with data. There are also plenty of free tools out there online that can help, although these often make it slightly more difficult to build the exact visualisation that you want.
Bear your audience in mind when creating visual content, but remember how important the visuals are – they will tell the tale of your story more than any number of words could. Get the visuals right, and the rest will fall into place.
For further information on improving the visuals of your content efforts, talk to our Team at Trusted Media about Content Marketing & Digital PR.